ELPRCMETHODOLOGY
Last modified in version : -
Purpose : retrieve the parameters and intervals based on which the PRC levels are defined.
Summary
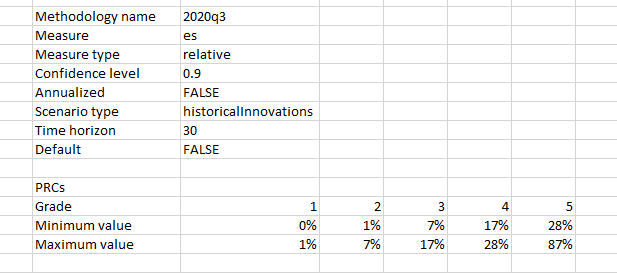
The ELPRCMETHODOLOGY function returns 3 types of output. If no parameters are inserted, the output will be the Edgelab methodologies that can be inserted as the first parameter: “2020q3” and “2020q3-liquidity”. If only “MethodologyName” is specified, you’ll get the summarized view, namely a table with the PRC levels and their intervals (maximum and minimum value) - the value is the relative ES. Finally, if you set to TRUE “ShowDetails”, in addition to the PRC levels and values, you’ll have a view of the different parameters used during the calibration (e.g. confidence level, time horizon, etc).
Examples
=ELPRCMETHODOLOGY("2020q3", TRUE)
Retrieves the parameters used in the PRC calibration and the intervals provided by the distribution of relative ES. The distribution comes from a universe of 11000 assets that represent the market. For more details, do not hesitate to ask for the PRC_PRG_methodology documentation. The parameters are the risk methodology, the risk measure, the measure type (relative or absolute), the confidence level, annualized, the scenario type (“historicalInnovations” or “historicalReturns”), the time horizon, and default. If default is FALSE, then the selected methodology in “MethodologyName” is not the default methodology, or else it is.

Syntax
ELPRCMETHODOLOGY(methodologyName, showDetails)
| Argument name | Description | |
|---|---|---|
| methodologyName | “2020q3” or “2020q3-liquidity” | |
| showDetails (Optional) | FALSE | Boolean, if set to TRUE, the parameters used in the calibration are shown, or else only the PRC levels and the intervals are displayed. |